Economic Analysis
The goal of economic analysis is to inform and support business decisions and reserve estimates. For some decisions, the answer is clear from an initial project overview. For others, much more detail is required. Most aspects of reservoir management involve economics - from acquisition through field development planning, consideration of secondary/enhanced recovery projects, evaluation of project effectiveness, production optimization, and finally divestiture.
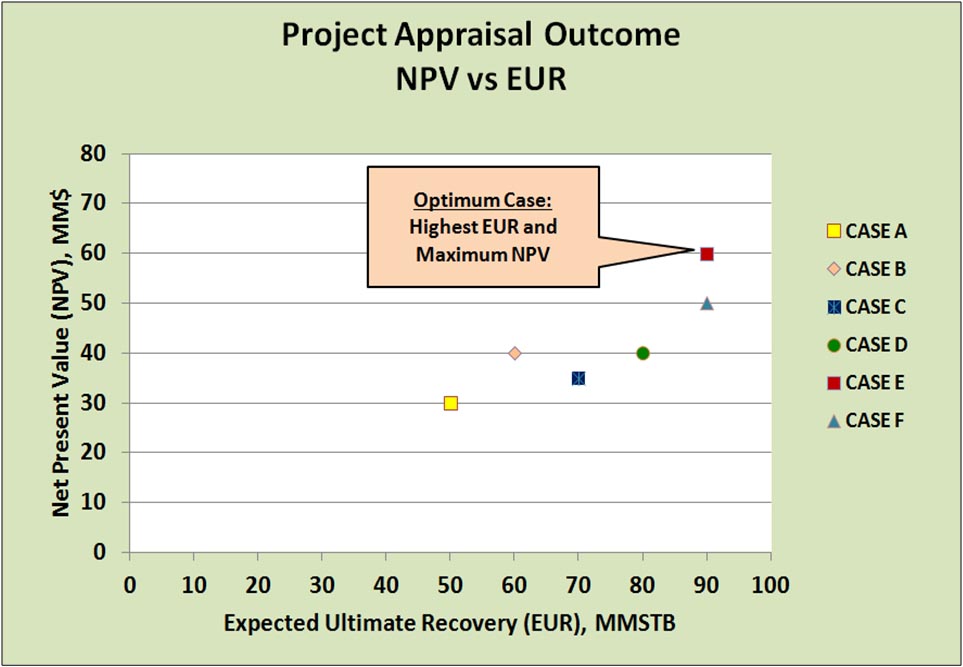
One aspect of economic analysis that sometimes seems counter-intuitive is that the lowest cost scenario does not necessarily generate the optimal solution. For example, a reduction in the cost structure to meet capital efficiency goals would tend to improve project economics and widen the scope of commerciality. However, optimization in a development plan with multiple scenarios is indicated by the case having the highest expected ultimate recovery (EUR) with the maximum positive net present value (NPV).
The optimal solution requires more than just economics - the analysis must be based on an accurate reservoir characterization to reduce risk and uncertainty. Decisions based on incomplete or inaccurate reservoir knowledge are more likely to be wrong or misleading. A targeted study on your reservoir which more fully utilizes existing data can pay off many times its cost by increasing your confidence in reserves estimates and business investment choices.
P90-P50-P10 Exceedance Probabilities
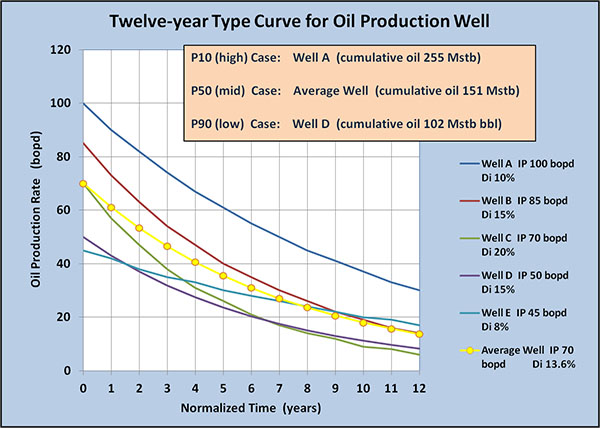
The construct of P90-P50-P10 exceedance probabilities has been adopted throughout the industry as a simple measure of variability in well performance. By convention, P90 means the forecast rate will be achieved by 90% of the producers in the sample space while P10 refers to an exceptionally high rate prodicible by only 10% of the group. The P50 probability relates to the average well performance or what would be expected from the majority of wells put on production.
Each of the exceedance probabilities considers two components of a well's deliverability profile: the initial potential (IP) of the producer and the decline rate (Di) which is a constant for exponential fall-off. A summary well or type curve is developed (example right) which illustrates a technique for determining the performance parameters for the three probabilities. The production histories of five oil wells were tabulated and plotted to compare IP, Di, and cumulative oil in the analysis period. It is the total oil produced that exemplifies the capacity of the well to deliver oil, hence the highest cumulative is the P10 performance probability. Similarly, P90 is defined by the lowest total oil produced and the average well has the P50 cumulative oil. The risked deliverabilities become the basis for new well forecasts and reserves.